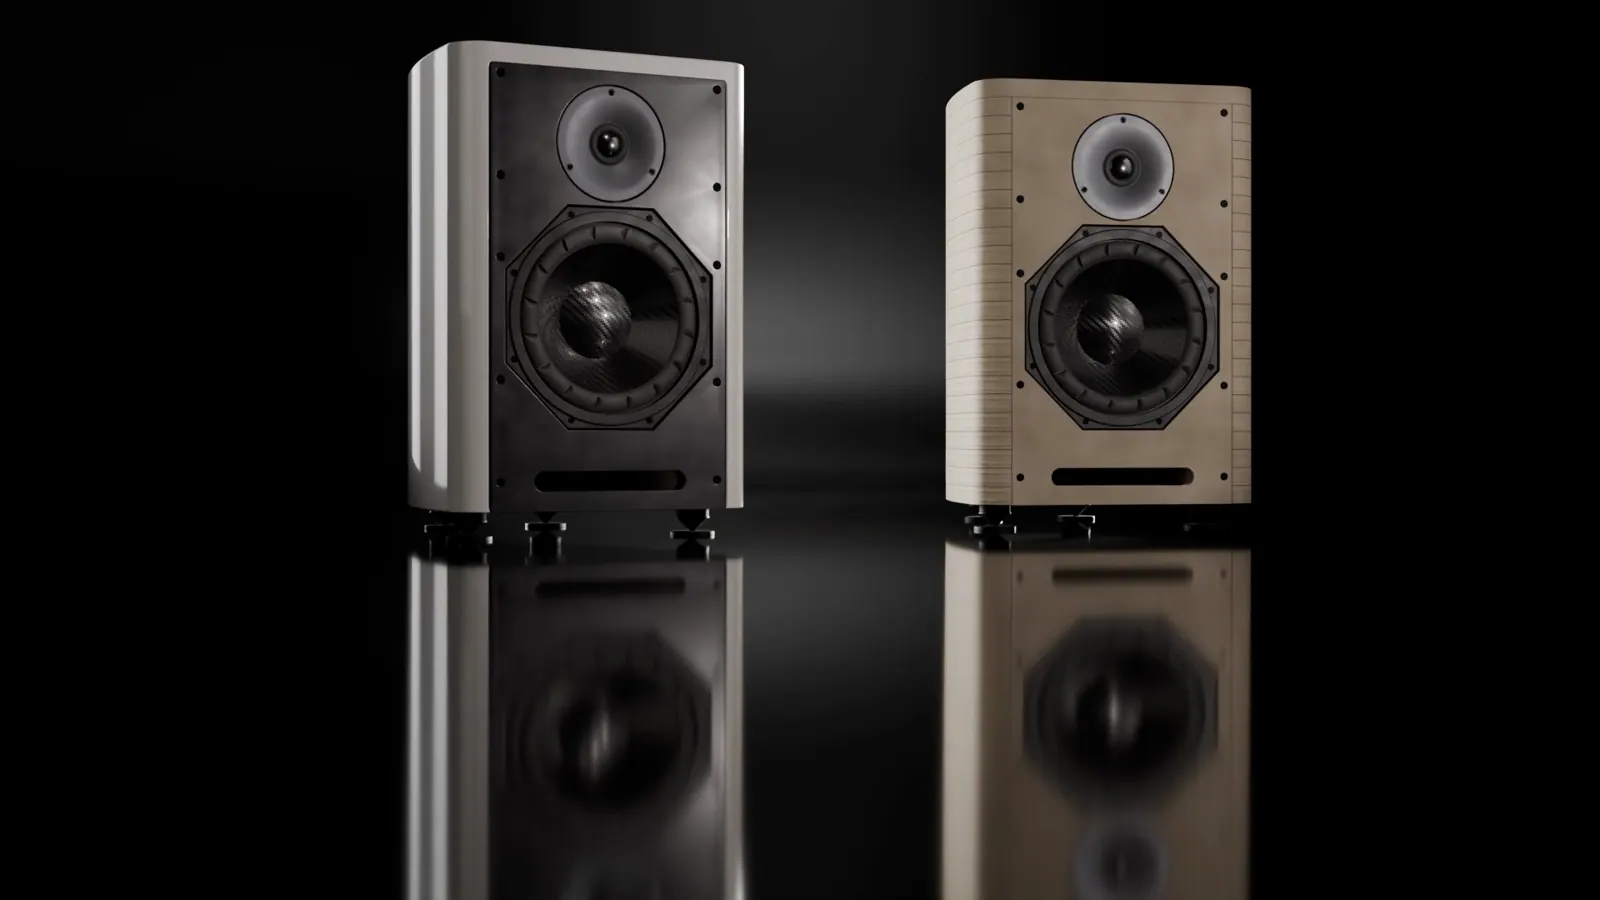
3D visualisation based on the Opus I design.
A loudspeaker cannot be understood through driver size or a single specification alone. Its behaviour emerges from the relationship between the enclosure, drivers, crossover, room and amplification. These are the design decisions and measurements that help explain Opus I.
01 · Frequency response
Balance across the frequency spectrum.
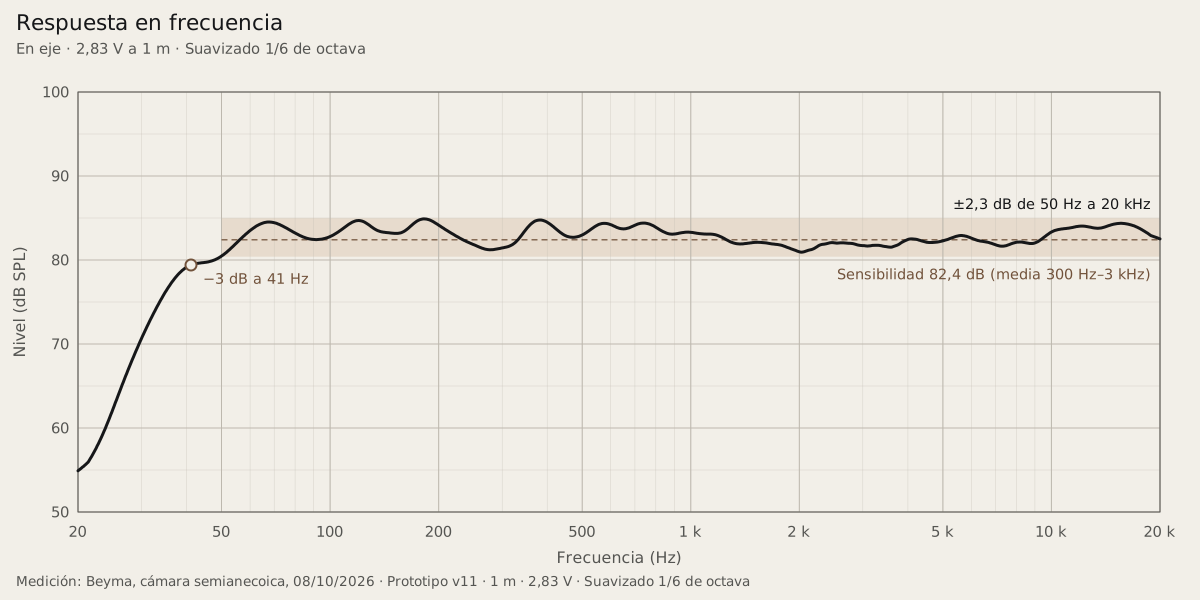
Frequency response describes how acoustic output varies with frequency. In the on-axis measurement of prototype v11, Opus I remained within ±2.3 dB between 50 Hz and 20 kHz. In the bass, the response reached its −3 dB point at approximately 41 Hz.
A uniform frequency response is one of the project's priorities. In a domestic room, the result also depends on loudspeaker positioning, room acoustics and the listening position.
02 · Horizontal dispersion
Music is not heard from a single point.
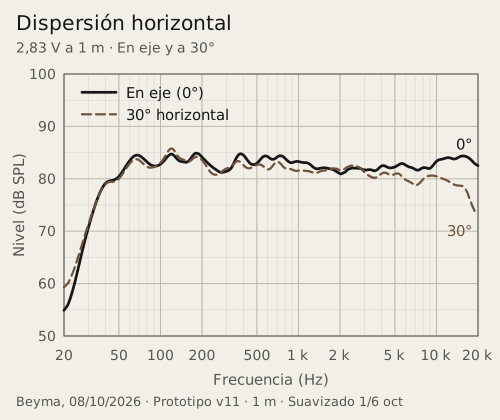
Direct sound and room reflections both contribute to the listening experience. This makes off-axis response worth examining. In the available tests, the horizontal 0° and 30° curves remained close up to approximately 3 kHz, with a progressive reduction in high-frequency output away from the axis.
A smooth, progressive reduction in off-axis treble is a desirable characteristic. It can contribute to a more consistent tonal balance across the listening space.
03 · Distortion and level
Examining what the signal acquires along the way.
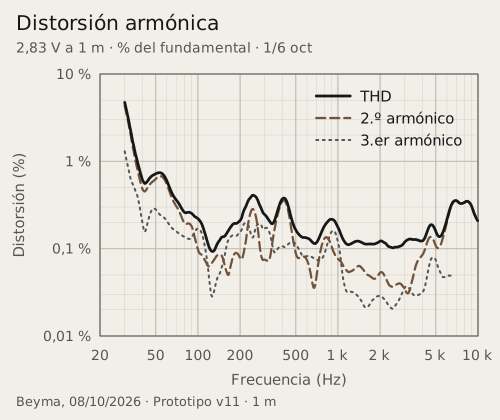
Harmonic distortion measures the additional frequency components generated when reproducing a test signal. At 2.83 V, total harmonic distortion in the prototype remained below 0.45 % above 100 Hz.
As output level increases, the drivers operate under different conditions. This is why we always present distortion figures alongside the test level.
04 · Impedance and amplification
A familiar load in high-fidelity systems.
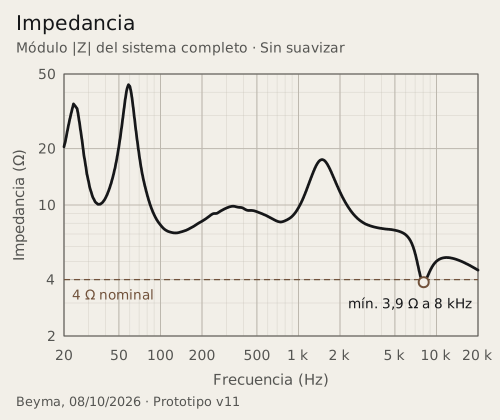
Opus I has a nominal impedance of 4 Ω, a common value in high-fidelity loudspeakers. Its impedance remains above 7 Ω across most of the frequency range where music carries the greatest energy.
Most quality amplifiers can drive 4 Ω loads without difficulty. Opus I can perform well with both transistor and valve amplifiers, provided they offer sufficient power and, in the case of valve amplifiers, a dedicated 4 Ω output. We recommend at least 50 W per channel into 4 Ω to provide adequate power headroom for music listening.
Measured sensitivity: 82.4 dB at 2.83 V/1 m (Beyma, prototype v11). Its relatively low sensitivity makes a useful reserve of amplifier power advisable.
05 · System integration and origins
The difference lies in integration.
The technical starting point was a combination of drivers and a crossover topology published by Beyma. The development of Opus I has addressed the Lira enclosure, its geometry, manufacturing and the physical implementation of the crossover, alongside other integration decisions. Acknowledging this starting point is part of how we explain our work.
View circuit diagram and component list
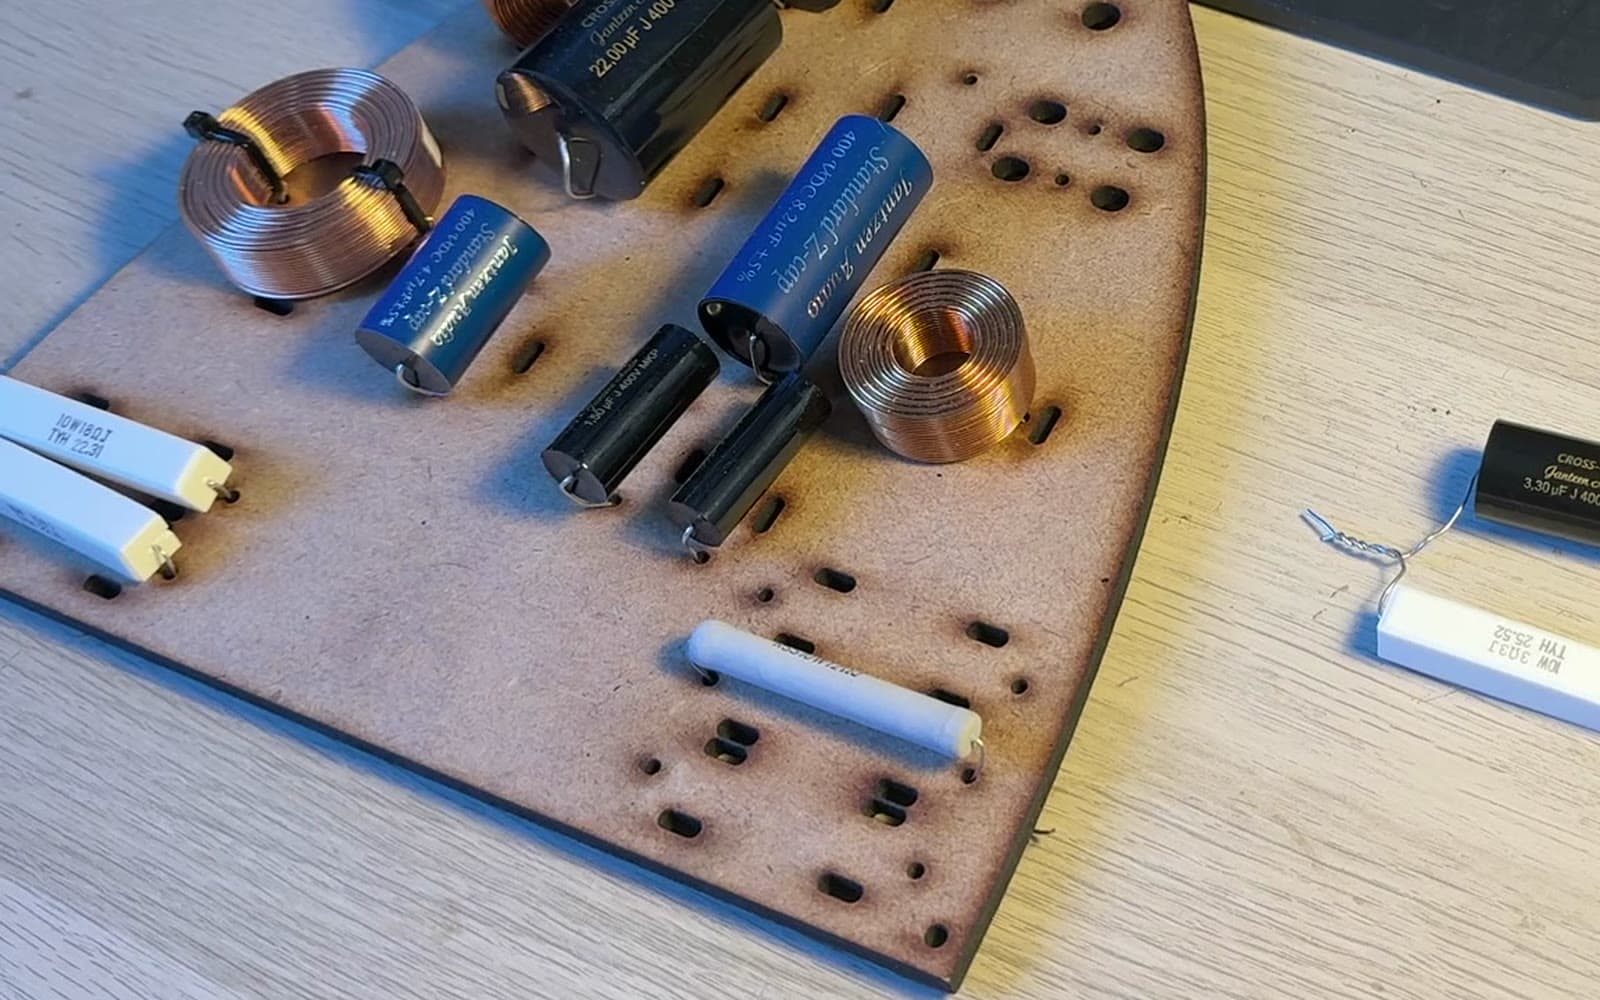
Reference topology published by Beyma for Beyma 8NMFW + T25M. Built using Jantzen components, a Dayton inductor (L1, fitted 1.5 mH) and a custom circuit board.
06 · Measurement record
Every measurement has its context.
The curves presented here come from tests on one unit of prototype v11 carried out by Beyma in Moncada, Valencia, on 8 October 2026. They document the behaviour recorded under those conditions and provide a precise record of Opus I's development.
| Unit | one unit of prototype v11 |
|---|---|
| Distance | 1 m |
| Voltage | 2.83 V; additional series at 5 V and 10 V |
| Environment | Beyma semi-anechoic chamber |
| Tests | frequency response, impedance and distortion; horizontal 0° and 30° |